AnaROS — the AI-native runtime and Pipeline Governor.
AnaROS is one of Anavec's two products. It operates the heterogeneous AnaRack — networking, CPU, multi-generation GPUs, memory, storage — as one governed system for guaranteed workload outcomes, and drops into your existing brownfield rack when the substrate isn't AnaRack. Two surfaces on one backend: Telemetry (visibility) sees what the pipeline is doing; Behavior (governance + guardrails) constrains what it — and the agents on it — are allowed to do. The Pipeline Governor is the AI-native decision engine that turns telemetry into action. Self-driving operation closes the loop — Diag → Recommend → Simulate → HITL → Act → Verify → Learn — on your rack. Air-gapped capable. Brownfield-ready.
01 · PIPELINE GOVERNOR
The AI-native decision engine
Turns telemetry into action. Above the device OS, below the agent — the runtime with authority over the substrate.
02 · TELEMETRY SURFACE
Visibility · vertical + horizontal
Workflow to silicon (vertical) and ingest to persistence (horizontal). See the symptom and its root cause on the same screen.
03 · BEHAVIOR SURFACE
Governance · placement + guardrails
Workload placement on the right silicon; guardrails for what autonomous agents do on the fabric — including agent-to-agent lateral paths.
04 · SELF-DRIVING LOOP
Diag → Recommend → Act → Verify → Learn
Closed operational loop that runs on your rack. Air-gapped capable. No SaaS. No external LLM. No egress.
05 · UNIFIED BACKEND
Five engines · one canonical state
Pipeline contracts · Placement engine · Live model · Stage telemetry · Change control — powering both surfaces from one backend.
CHAPTER 01 · VERTICAL VISIBILITY
Vertical workflow stack visibility collapses the time-to-root-cause across layers.
A single AI call traverses application code → runtime → GPU → fabric → storage in milliseconds. When p99 collapses, the symptom at the top usually has its root cause four layers down. AnaROS correlates and governs them cohesively.
Why four layers?
A single AI call traverses your application code → runtime → GPU → fabric → storage in milliseconds. When p99 collapses, the symptom at the top — a slow agent, a stuck retrieval, a timeout — usually has its root cause four layers down: a NIC buffer overflow, a NUMA miss, a noisy neighbor in another tenant. The dashboards you have today don't connect: K8s knows the pods, CUDA knows the kernels, the network team owns the spine — none of them see across boundaries. Business impact: minutes of service recovery become hours of downtime chasing the wrong layer.
AnaROS gives the rack one vertical view.
Four cooperating layers — L4 workflow, L3 pipeline X-ray, L2 logical fabric, L1 physical rack — visible from one operator surface. Trace any workflow top-to-bottom in a single pane, and the symptom and the root cause finally show up on the same screen. Scroll to drill into each layer.
L4 Application Workflow
The workflow your business actually runs.
Agentic flows, MoE applications, inspection pipelines — expressed as a controlled workflow graph with steps, branches, loops, and SLOs. This is the surface CIOs and product owners reason about.
Unit of work: the pipeline, not the GPU box
Inputs: intent, data sources, SLOs, tenant scope
What you see: 6 nodes · branch + merge · per-node host
Why it matters: outcomes are owned by the workflow
L3 Pipeline Infrastructure
One pipeline. Heterogeneous rack. Mixed GPU classes. Governed.
AnaROS decomposes each workflow into Ingest, Preparation, Execution, and Persistence across network, compute, memory and storage — and routes each stage to the right fit GPU class that holds its SLO. Heavy CNN/ViT inference doesn't mean every stage needs an H200.
Why it matters: 60-80% of compute isn't the H200 stage
L2 Logical Fabric & Resource Map
GPU-to-GPU logic flows, dynamically resourced.
The Anavec logical fabric resolves source/destination, bandwidth, and zero-copy paths between GPUs, the CPU sled, the staging tier, and storage. The resource map tells you what's allocated, what's draining, and what's free — at all times.
Heterogeneous ratios: 1:2 · 1:4 · 1:8 host-to-GPU
Memory staging fabric: warm pre-staging, no GPU wait
Resource map: CPU sleds, GPU shelves, memory tier
Why it matters: data is ready before the GPU asks
L1 Physical AI Data Center
A heterogeneous fabric — not a vendor SKU.
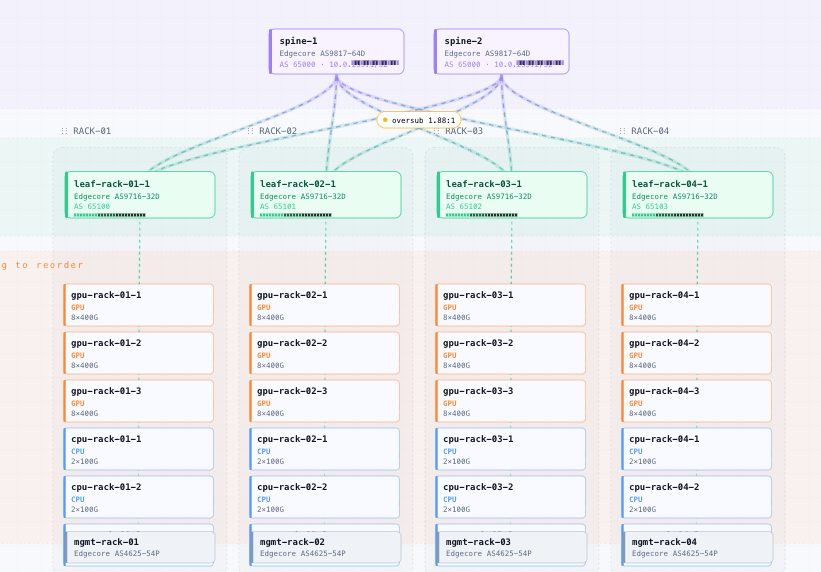
Standard rack envelope. Off-the-shelf modules. Programmable PCIe fabric. CPU and GPU refresh on independent clocks. Pipeline contracts resolve every pipeline edge to a physical switch port through live stage telemetry.
CPU sleds: x86 / ARM, 1U / 2U, refresh independently
Horizontal visibility, traceability, and governance through the data-serving journey — for business sustainability.
End-to-end governance across physical boundary from ingest to persistence for pipeline, workflow, or MoE in the agentic era. Where the vertical view tells you which layer, the horizontal X-Ray tells you where in the journey. Scroll to walk a real production pipeline — and find the root cause behind the obvious victim.
PIPELINE EXPLORER Inter-Stage · AAIF / collector-intelligence · live
GET /api/v1/collector-intelligence
HOST · anavec1-0
↔ intra-node
HOST · anavec1-0
↗ inter-node
HOST · anavec2-0
↗ inter-node
HOST · anavec1-0
INGRESS CPU-NET
cleared susp 23%
CNTR1
EBPFactive
HTTPp99 8761ms
CTRL
IPC
0.3 ms
kernel pipe
PREPARATION CPU-HEAVY
cleared susp 82%
CNTR1
EBPFactive
HTTPp99 8761ms
CTRL
FABRIC
8694 ms
leaf1-0 · Eth80→88
EXECUTION GPU
victim susp 49%
CNTR1
EBPFactive
GPU SM1%
CTRL
FABRIC
2.1 ms
leaf2-0 · Eth88→80
PERSISTENCE STORAGE-OPT
root cause susp 98%
CNTR1
EBPFactive
KERNELFlows —
CTRL
E2E JITTER WATERFALL
Total 19.0ms · measured 4% · unknown 96% (telemetry-gap)
ingress
0.0ms 100%
preparation
6.0ms 51%
staging
5.0ms 38%
execution
0.0ms 100%
post_processing
5.0ms 67%
persistence
6.0ms 59%
01 Visibility · the whole pipeline
The pipeline crosses many boundaries.
This workflow lives on anavec1(GPU) for ingress and preparation, hops across fabric to anavec2(GPU) for GPU execution, then hops back to anavec1 for storage. Pipeline X-Ray sees all of it — intra-node IPC, inter-node fabric, leaf switches, every stage.
Ingress and Preparation both live on anavec1 — but they're separate processes in separate containers, talking through a kernel pipe. Most observability stacks lose visibility here. The X-Ray traces it: pipe-buffer occupancy, context switches, container CPU contention.
Kind intra-node IPC · kernel pipe buf
Latency 0.3 ms · throughput line-rate
Context switches 4.2k/s · sched p99 12 µs
Container CPU contention yellow on preparation
03 Inter-node · fabric hop
Where the pipeline leaves the host.
Preparation on anavec1 hands off to Execution on anavec2 — across a real fabric edge. Without pipeline-over-fabric correlation, this hop goes dark. With stage telemetry pinned to fabric identity, the X-Ray lands on a specific switch port pair on leaf1-0 and surfaces drift, loss, and ECMP right there.
Observed 0.00 Gbps · loss 0 ppm · p99 8694 ms (upstream)
04 Pipeline contracts · reconciled to fabric
One view that ties pipelines to fabric paths.
Every pipeline edge reconciled with its physical path through leaf/spine. ECMP divergence becomes legible. Ask "where does this workflow live on this fabric?" — and get a topology answer, not a Grafana stack.
Six telemetry domains (Node, Kernel, Process, Net L2/L3, TCP, HTTP/L7, gRPC/H2) crossed with six collector layers (SDI/SSH, Prometheus, cAdvisor, eBPF/Beyla, SDK Py/C++, OTel/OTLP). Each phase adds signals — and unlocks new RateGate capabilities.
Where it lives AnaROS Pipeline · Multi-tier Telemetry tier
06 Governance · the switch is a first-class object
Leaf1-0, in its own words.
Open the switch and you see stage-telemetry signals reconciled to the fabric: resolved endpoints, reconstructions, drifts, violations, latest tick. Verdicts and pending mitigations live next to the switch they apply to, not in a separate ticketing system.
Resolved endpoints 2 / 57 — including the affected pipeline
Reconstructions 2 · hops on switch 2 · drifts 0
Latest tick #24282 · 4s ago · ring depth 100
Governance posture 0 pending · 0 pending verdicts
07 End-to-end · victim → root cause
Execution is the symptom. Persistence is the cause.
In this example, GPU SM 1% looks like a GPU problem, but the X-Ray correlates intra-node, inter-node, and fabric signals across all stages — and lands on Persistence (suspicion 98%). Storage IOPS contention back-pressures execution upstream all the way to ingress.
Victim execution · GPU SM 1% · suspicion 49%
Root cause persistence · suspicion 98% · 59% of tail
Blast radius 1 pipeline, 2 hosts, 2 leaf switches
Auto-action Governor rate-gate · tenant notified
stage detail
live · poll 5s
IngressCPU-NET
PERFORMANCE
p99 latency
8761.0 ms
p95 latency
—
throughput
0.2 rps
queue depth
—
METRICS
cntr
1
ebpf
active
http
p99 8761ms
kernel
Flows 115 MB/s
net
Rx 88 MB/s
node
CPU 0%
process
Container CPU —
throughput
122 req/s
Stage is cleared. Suspicion is low — the latency here is upstream backpressure leaking into ingress, not a problem with this stage.
CTRL · open in collector
Fabric · Pipeline-to-Fabric View
rack-keyed · pipeline contracts reconciled on fabric
Stage telemetry on fabric + governance · last tick 4s ago
Identity
SIDleaf1-0
Mgmt IP10.110.3.25:8080
Ports67
StateActive
Stage-Telemetry Signals
Resolved endpoints2 / 57
Reconstructions2
Hops on switch2
Drifts0
Latest tick#24282 · 4s ago
Governance Posture
PENDING
0
HISTORICAL
0
PENDING VERDICTS
0
RESOLVED ENDPOINTS · 2 of 2
PIPELINE
EDGE
PORTS
BOUND
langgraph-semantic-moe
preparation → execution
leaf1-0:Eth80 → leaf2-0:Eth80
✓ bound
langgraph-semantic-moe
post_proc → persistence
leaf2-0:Eth88 → leaf1-0:Eth80
✓ bound
CHAPTER 03 · WORKLOAD PLACEMENT + GOVERNANCE
Rack-level workload placement and governance — to maximize utilization and minimize CAPEX.
Archetype → Demand → μ service rate → SLO/ε budget → Filter → Score → Select — every stage placed deterministically against the live model of the rack. Same reliability, fewer servers. Every GPU, every loaded model, every active pipeline attributable — ledger contract versus reality, in real time.
PLACEMENT ENGINE · ONE MAP · ONE SLO · ONE LEDGER
every stage placed to the best-fit node — regardless of workload type, silicon, or rack location
IN PLAIN ENGLISH
Every stage of every workload — MoE experts, agentic tools, RAG retrieval, batch training — is placed by the same engine to the best-fit node it can prove will hold the SLO. The rack composition matters: MoE fans out across NVIDIA + AMD when the numbers say so; agentic bursts to cloud when local queues saturate; RAG stays on the rack with the vectors and the storage; fine-tune packs onto a cloud rack it doesn't compete for. One resource map. One SLO. One ledger. Same math whether the stage lands in-rack, across racks, or across clouds.
Resource Map · What the Engine reads from
A live model of the rack — every host, every GPU, every loaded model, every active pipeline.
The Placement Engine doesn't guess. It queries a canonical, second-by-second model of the rack on every decision — the same source of truth that powers telemetry, chargeback, and audit.
B14 Resnet Classify ×
HOT 8WARM 4COLD 14
LIVE
RESOURCE MAP · TWEAKS
lightdark
Cluster topology
Overlay
Ledger contract (ghost)
Contention badges
Node utilization fill
Flow particles
Flow speed 1.2×
LEAF
switch-sonic-as4625
SONiC · 54×1GMGMT
anavec1 · 192.168.9.155· DGX
CPU HEAD NODE
CPU0 20c
NVMe0
NVMe1
NIC0
NIC1
BMC
GPU TRAY · 1×GB10
GPU #0 · GB10 · 119GB36%
vram 42.85 / 119 GB36%
2 models loaded · GPU 18% · SM 12%
MEMORY · 119GB unified
42.85 / 119 GB36%
LOADED MODELS · 2
WARMQwen/Qwen3-8B
COLDTinyLlama/Chat-v1.0
PIPELINES · 12 active
healthy · ssh+nvidia-smi · 5s ago
anavec2 · 192.168.9.156· DGX
CPU HEAD NODE
CPU0 20c
NVMe0
NVMe1
NIC0
NIC1
BMC
GPU TRAY · 1×GB10
GPU #0 · GB10 · 119GB55%
vram 65.75 / 119 GB55%
3 models loaded · GPU 28% · SM 22%
MEMORY · 119GB unified
65.7 / 119 GB55%
LOADED MODELS · 3
WARMQwen/Qwen3-32B
COLDQwen/Qwen2.5-1.5B-Instruct
COLDTinyLlama/Chat-v1.0
PIPELINES · 18 active
healthy · ssh+nvidia-smi · 5s ago
anavec3 · 192.168.9.157· DGXselected
CPU HEAD NODE
CPU0 20c
NVMe0
NVMe1
NIC0
NIC1
BMC
GPU TRAY · 1×GB10 · executing B14
GPU #0 · GB10 · 119GB30%
vram 36.18 / 119 GB30%
1 model loaded · GPU 2% · SM 1%
MEMORY · 119GB unified
36.2 / 119 GB30%
LOADED MODELS · 1
HOTmicrosoft/resnet-50 (B14 active)
PIPELINES · 19 active
healthy · ssh+nvidia-smi · 5s ago
GPU · #0 · GB10
server-anavec3 · gpu-anavec3-0
2%
GPU UTIL
30%
VRAM UTIL
30%
MEM UTIL
FABRIC BANDWIDTH
Scale-Up ethernet · intra-rack0 / 1 Gbps
Scale-Out ethernet · cross-rack0 / 1 Gbps
MODELS · 1 LOADED
HOTmicrosoft/resnet-50B14
182 MB · loaded 14h ago
PIPELINES · 19
B14 Resnet Classify ▸ exec
+ Adaptive Rag App, B10-B13, B15-B16, …
B14 · LEDGER vs REALITY SYNTHESIZED
ledger
actual
GPU-hrs
9.5
0.078
Bandwidth
0.31 Gbps
0.248 Gbps
contract gap · synthesized until ledger_claims × xray
PATH · 3 HOPS
LEAF
switch-sonic-as4625
ingress
0%
SERVER
anavec3
compute
0%
GPU #0
GB10
execute
2%
CHAPTER 04 · INFRASTRUCTURE GUARDRAILS
Guardrail for the underlying AI infrastructure.
Two lanes. SecOps app-layer gateways govern what the agent says. AnaROS governs what the agent does on compute, network, memory, and storage. Complement, not competitor.
AUTONOMOUS AGENT
reasons · decides · acts
SECOPS · APP-LAYER GATEWAY
complement
Govern what the agent says.
MCP / LLM /API gateways sit with SecOps. They own the conversation — prompt policy, tool-call scope, output filters.
Intent in language — prompts, agent plans
Tool-call policy — allowed APIs, allowed args
Blind spot the moment the agent leaves language
→ leaves the gateway's view
ANAROS · INFRASTRUCTURE GUARDRAILS
focus
Govern what the agent does.
The moment an agent SSHes a switch, pushes config, or shifts traffic — static rules (ACLs, segments) can't reason about intent, scope, or consequence. AnaROS provides Infra teams with the governance + visibility for the unguarded surface.
Reconstruct actions — every touch on the fabric, replayable
Gate + rollback destructive actions held for approval; rollback ready
VERDICT · PRE-EXECUTION
action tiered before it fires · rollback ready
Pipeline 7's 200 Gbps execution stage would black-hole · p99 +340 ms · SLO breach in ~12 s · blast tier T4.
AI INFRASTRUCTURE — the surface AnaROS guards
COMPUTE
CPU · GPU · accelerators
NETWORK
spine · leaf · fabric ports
MEMORY
a new memory tier · staging
STORAGE
object · NVMe · OLAP
First demonstration on network fabric. Same engine extends to compute, memory, storage as AnaRack surfaces.
CHAPTER 05 · UNIFIED BACKEND
Five engines. One canonical state. Two surfaces. One Pipeline Governor.
Anyone can ship a dashboard or a policy gate. Only AnaROS has the canonical state and the engines behind it — which is why the consequence verdict is real, not pattern-matched text.
ENGINE 01
Pipeline contracts
Per-pipeline SLA + path + policy
Every pipeline declares its operating contract once — SLA, path, policy. Enforced everywhere.
ENGINE 02
Placement engine
Math-derived decisions
Where each stage runs. Whether the next workload admits. Deterministic math against the live model.
ENGINE 03
Live model
Always-fresh rack picture
Every rack, drawer, link, pipeline, model — one live picture, provenance-stamped, sub-minute cadence.
ENGINE 04
Stage telemetry
End-to-end stage instrumentation
Per-stage instrumentation across CPU, GPU, fabric, storage. Attributes p99 to where the latency was born.
ENGINE 05
Change control
Pre-execution + tier + rollback
Every action tiered before it executes. Destructive ones gated for approval. Rollback ready.
CANONICAL STATE
every rack, drawer, link, pipeline, model — provenance-stamped, sub-minute cadence
the one source of truth
↓THE SAME FIVE ENGINES POWER ALL THREE CAPABILITIES↓
CAPABILITY 01
Visibility
From workflow to silicon — vertically across layers, horizontally across the pipeline journey.
CAPABILITY 02
Workload Governance
Placement, admission, and pipeline governance — maximize utilization, minimize CAPEX.
CAPABILITY 03
Infrastructure Guardrails
Predict what an action does to the live fabric — before it does it. Tier, scope, blast-radius gate.
ONE UX
One console. One canonical state. One contract from software-first to full platform. The depth of the foundation is what makes both surfaces — and the Pipeline Governor above them — possible.
One AI-native runtime. Two surfaces. One Pipeline Governor. Air-gapped capable. Brownfield-ready.
Vertical visibility → Horizontal visibility → Workload placement + governance → Infrastructure guardrails — all powered by the same five engines and one canonical state. The same AnaROS console runs on your homelab today.
Next step · Instrument · Profile · Pilot
Request a briefing
hello@anavec.ai